Are we there yet? A dashboard can help show the way
- July 31, 2015
- / Reggie Dogan
- / education

We live in a time of “data-overload” and many people have to make sense of the numbers as part of their daily lives.
This is where dashboards come into play. A well-designed dashboard can save a lot of time, helping people to quickly identify the numbers that matters the most.
The Studer Community Institute’s dashboard is a tool we use to provide an at-a-glance look at the Pensacola Metro area’s growth, educational attainment, economic prospects, public safety, environment, culture and community.
In an effort to make the dashboard more helpful, relevant and user-friendly, we are in the process of updating and improving our dashboard.
That’s where you come in. We want the dashboard to be useful and relevant and just right for you.
A good dashboard is one that embeds itself into a people’s daily routines.
Cluttered displays deflect the focus from the important messages. It’s easy to create a cluttered mess of numbers, but the discipline in cutting them down, and crafting a useful dashboard forces you to think about what matters most to your mission and goal.
In the 2014 Pensacola Metro Report education emerged as this community’s No. 1 priority. It is among the 16 key issues on our dashboard and one of the most important factors in improving the quality of life for the people who live here.
Of Florida’s 67 school districts, Santa Rosa state assessment scores ranked among the top five.
While Escambia County has improved, the district still suffers in key area.
With 64 percent of its students on a free or reduced-price lunch plan, a 64 percent graduation rate and 45 percent being raised in a single-parent household, Escambia struggles with issues many top-performing school districts don’t have.
Under the key topic of education, the dashboard now features free and reduced-priced lunch, kindergarten readiness and high school graduation rates.
Each of them, we believe, gives a snapshot of trajectory of education from pre-kindergarten through high school.
Making an impact in education, both in building our knowledge and skills as well as our understanding of one another, is worthy of the best and brightest minds.
Having a better-educated community will be a prerequisite to improving many other aspects of society.
Bur there are an infinite number of metrics that can be measured in education, and we’d like to know what you think the most important ones are.
Is it third-grade reading proficiency? Assessment scores? Or how districts spend per student?
A usable, informative dashboard is only as good as the metrics that are measured. Dashboards, at their best, tell us where we are and how far we need to go in meeting our goals and reaching our destination.
The purpose of a good dashboard reminded me of the existential dialogue between Alice and the metaphorical genius Cheshire Cat in Lewis Carroll’s classic children’s book, “Alice in Wonderland”:
“One day Alice came to a fork in the road and saw Cheshire Cat in a tree. ‘Which road do I take?’ she asked.
‘Where do you want to go? was his response. ‘I don’t know,’ Alice answered. “Then,’ said the cat, ‘it doesn’t matter.”
Not having a direction, not having a goal, not knowing where you are going, it’s all the same. You end up nowhere.
If we don’t know where our community is going in education, in economic prospects or in the area’s growth, we’ll end up where we started.
The Pensacola Metro area has made some progress in the past few years.
Downtown is on the rise, new businesses are cropping up, our high school graduation rate is better that it was 10 years ago. But we can’t afford to rest on our laurels.
We need a blueprint, a roadmap, measurable, definitive data to plot a progressive course of action.
A popular saying is, “What get measured, gets improved.”
We have to set and measure benchmarks to help us make right adjustments to improve our quality of life.
I look forward to seeing the suggestions on the education metrics you think we should include in our new and improved dashboard.
Where are we going as a community? Answering the question is important. If the answer to the question is anywhere, we’re probably already there.
Recent Posts
-
 CivicCon launches with a look at good growth in cities
-
 Building stronger brains one baby, one parent at a time
-
 SCI debuts commercial on Early Learning City
-
 Entrecon: World class speakers and an opportunity to sharpen skills
-
 PYP Quality of Life survey 2017
-
 EntreCon Pensacola 2016: A look back
-
 Leadership tip: getting better employee takeaways
-
 Leadership tip: be interested instead of interesting
-
 Leadership tip: delivering difficult messages
-
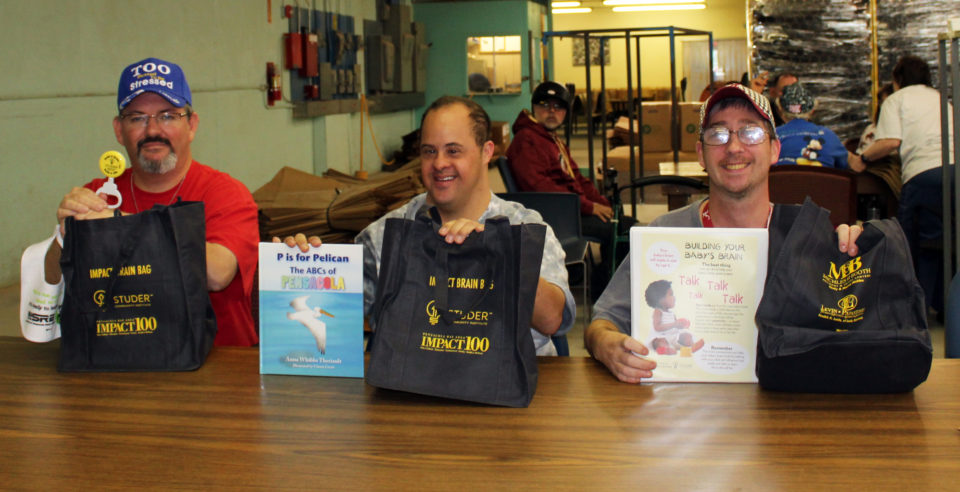 Brain Bags boost Arc, Early Childhood Court programs