Escambia County struggles to retain high-income households
- December 23, 2015
- / Shannon Nickinson
- / community-dashboard

Crews work on a new home being constructed in the East Hill neighborhood in Pensacola, Fla., Thursday, December 5, 2014. (Michael Spooneybarger/ Pensacola Today)
Who’s coming and who’s going?
That’s the question that the University of West Florida’s Phyllis Pooley looks into in analysis of population migration she recently conducted.
Pooley’s answer is stark.
“Escambia County may have a brain drain,” Pooley writes.
Between 2007-2011, more people with higher degrees moved out of Escambia County than into Escambia County.
More higher wage workers moved out of Escambia than into the county, as well.
What kind of workers did Escambia gain? Those in service industry, sales and office workers, and military-specific occupations.
There may be anecdotal signs that the better news is on the way.
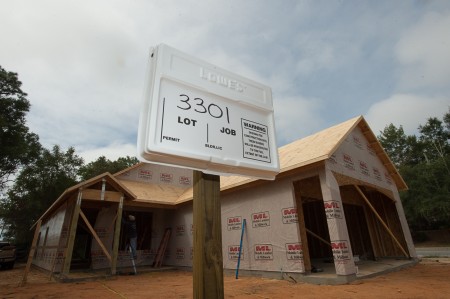
New home construction at King’s Way and Spanish Trail Monday, Oct. 5, 2015.(Michael Spooneybarger/ Studer Community Institute)
New home construction in the Pensacola city limits was up 200 percent for 2015 compared to 2010. And infill housing in the city limits is a trend that is developing.
In Santa Rosa County, 2013-2014 fiscal year saw the biggest surge in residential construction since 2006.
Read on to see Pooley’s take on the numbers.
By PHYLLIS K POOLEY
Growth in a community often depends upon an area’s ability to attract and retain people.
Economic factors, such as availability of employment, and local amenities, such as cultural attractions and weather, also play a role in migration decisions.
With its five-year datasets from the American Community Survey, the U.S. Census Bureau classifies movers by type of move (inbound or outbound) and characteristics of movers.
The Census Flow Mapper application can view both the numbers of movers both in and out of an area as well as some information about the movers. While there are limitations to the data it can provide potential insights into the demographics of new and former residents.
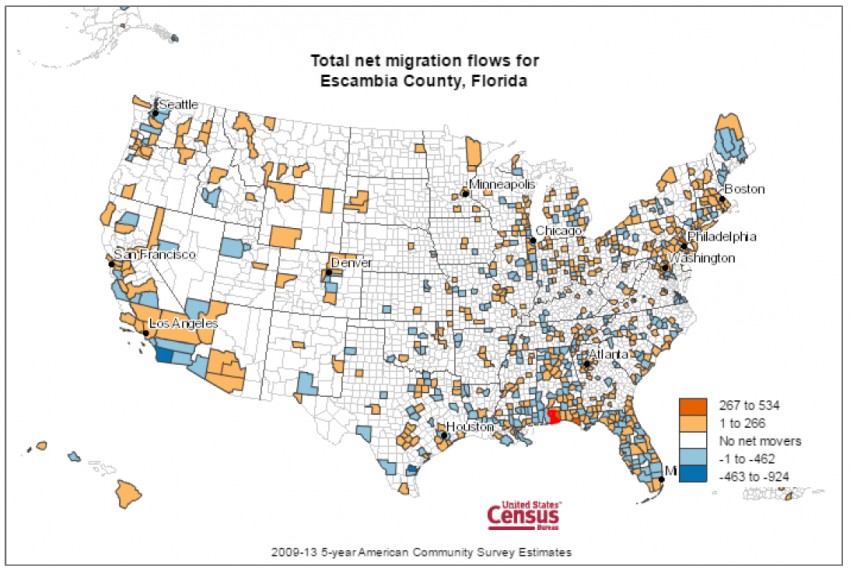
The community survey tracks where families and individuals go when they move from Escambia County. It also tracks where they come from when they relocate here.
Top outbound locations for the 2009-13 time frame were Santa Rosa County, San Diego County, California, Nueces County, Texas, and Baldwin County, Alabama.
Top inbound locations were Santa Rosa County, Duval County,San Diego County, California, and Baldwin County, Alabama.
More people move from Santa Rosa to Escambia than move from Escambia to Santa Rosa
In every time period available from the Census Bureau, movers from Santa Rosa County to Escambia County outnumber those moving from Escambia to Santa Rosa. These are just estimates, and the Census Bureau cautions against comparing overlapping time frames, but the data seem to suggest that this might be the case.
2009-13 2008-12 2007-11 2006-10 Santa Rosa to Escambia 2,616 2,299 2,376 2,633 Escambia to Santa Rosa 2,082 2,280 2,263 2,647 Armed forces comings and goings represent approximately 18 percent of migration activity
Military installations have an effect on local migration patterns. From 2008-2012, the Census Bureau provided data for movers by employment in the armed forces.
The number of inbound and outbound military movers (the number moving in minus the number moving out totals the “net mover”) represented about 18 percent of total movers in that time frame.
The numbers do not always balance out as more people, for example, move from Escambia to San Diego and Corpus Christie than vice versa due to the normal advancement path of Navy flight training.
Escambia County may have a brain drain
From 2007-2011, the Census Bureau analyzed migration estimates in relation to the educational attainment of the inbound and outbound movers. In Escambia County, more people with higher degree levels moved out than in.
< High School High School Graduate Some College Bachelor's degree and above Total IN 1,170 1,665 2,606 1,194 Total OUT 1,105 1,941 2,959 2,143 NET migration 65 -276 -353 -949 Escambia is not retaining high income households
Data from the 2008-12 community survey shows only one household income category – those that earn $35,500-$49,999 annually – having net positive migration.
Loss of higher income individuals may be reflected in the loss of those with higher levels of education.
<$35,000 $35-49,999 $50-74,999 $75-99,999 $100-149,999 $150,000+ Total IN 2,628 1,919 1,670 762 598 626 Total OUT 3,429 1,279 2,264 1,651 1,364 761 NET migration -801 640 -594 -889 -766 -135 Escambia County attracts service, sales and military industry workers
In the 2008-12 time period, Escambia County grew in occupations involved in the service industry, sales and office workers, and military-specific occupations. Given that this time frame encompasses the Great Recession, losses in construction and maintenance jobs are not surprising.
Management, business, science, art Production, transportation, material moving Service Natural resources, construction, maintenance Sales and office Military Specific Occupations Total IN 2,390 944 2,657 1,720 2,090 3,420 Total OUT 3,015 1,699 2,129 2,453 1,964 2,068 NET migration -625 -755 528 -733 126 1,352 More variables are available in the Census Flows Mapper at http://flowsmapper.geo.census.gov/.
Phyllis K Pooley is the director of special projects for the UWF Office of Economic Development and Engagement and has more than 15 years of experience working with demographic data.
Recent Posts
-
 CivicCon launches with a look at good growth in cities
-
 Building stronger brains one baby, one parent at a time
-
 SCI debuts commercial on Early Learning City
-
 Entrecon: World class speakers and an opportunity to sharpen skills
-
 PYP Quality of Life survey 2017
-
 EntreCon Pensacola 2016: A look back
-
 Leadership tip: getting better employee takeaways
-
 Leadership tip: be interested instead of interesting
-
 Leadership tip: delivering difficult messages
-
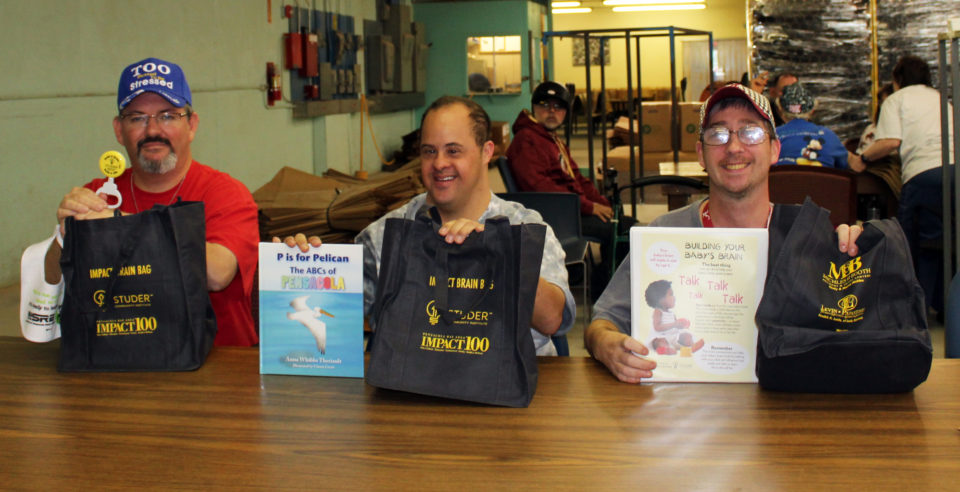 Brain Bags boost Arc, Early Childhood Court programs